


Needing A Great Resource for Teaching Your Students About Utah Fossils?
by Marshall Robinson
The UGS has many resources and tools for teachers including teaching kits, geologic guides, geology-related videos, and maps. Additionally, our interactive web maps are a great resource to start with as they provide a wide variety of geologic information in one spot that teachers from across the world can access. Over the past several years, the UGS has created these user-friendly, information rich interactive maps to enable map users to explore and understand geology in a more immersive way.
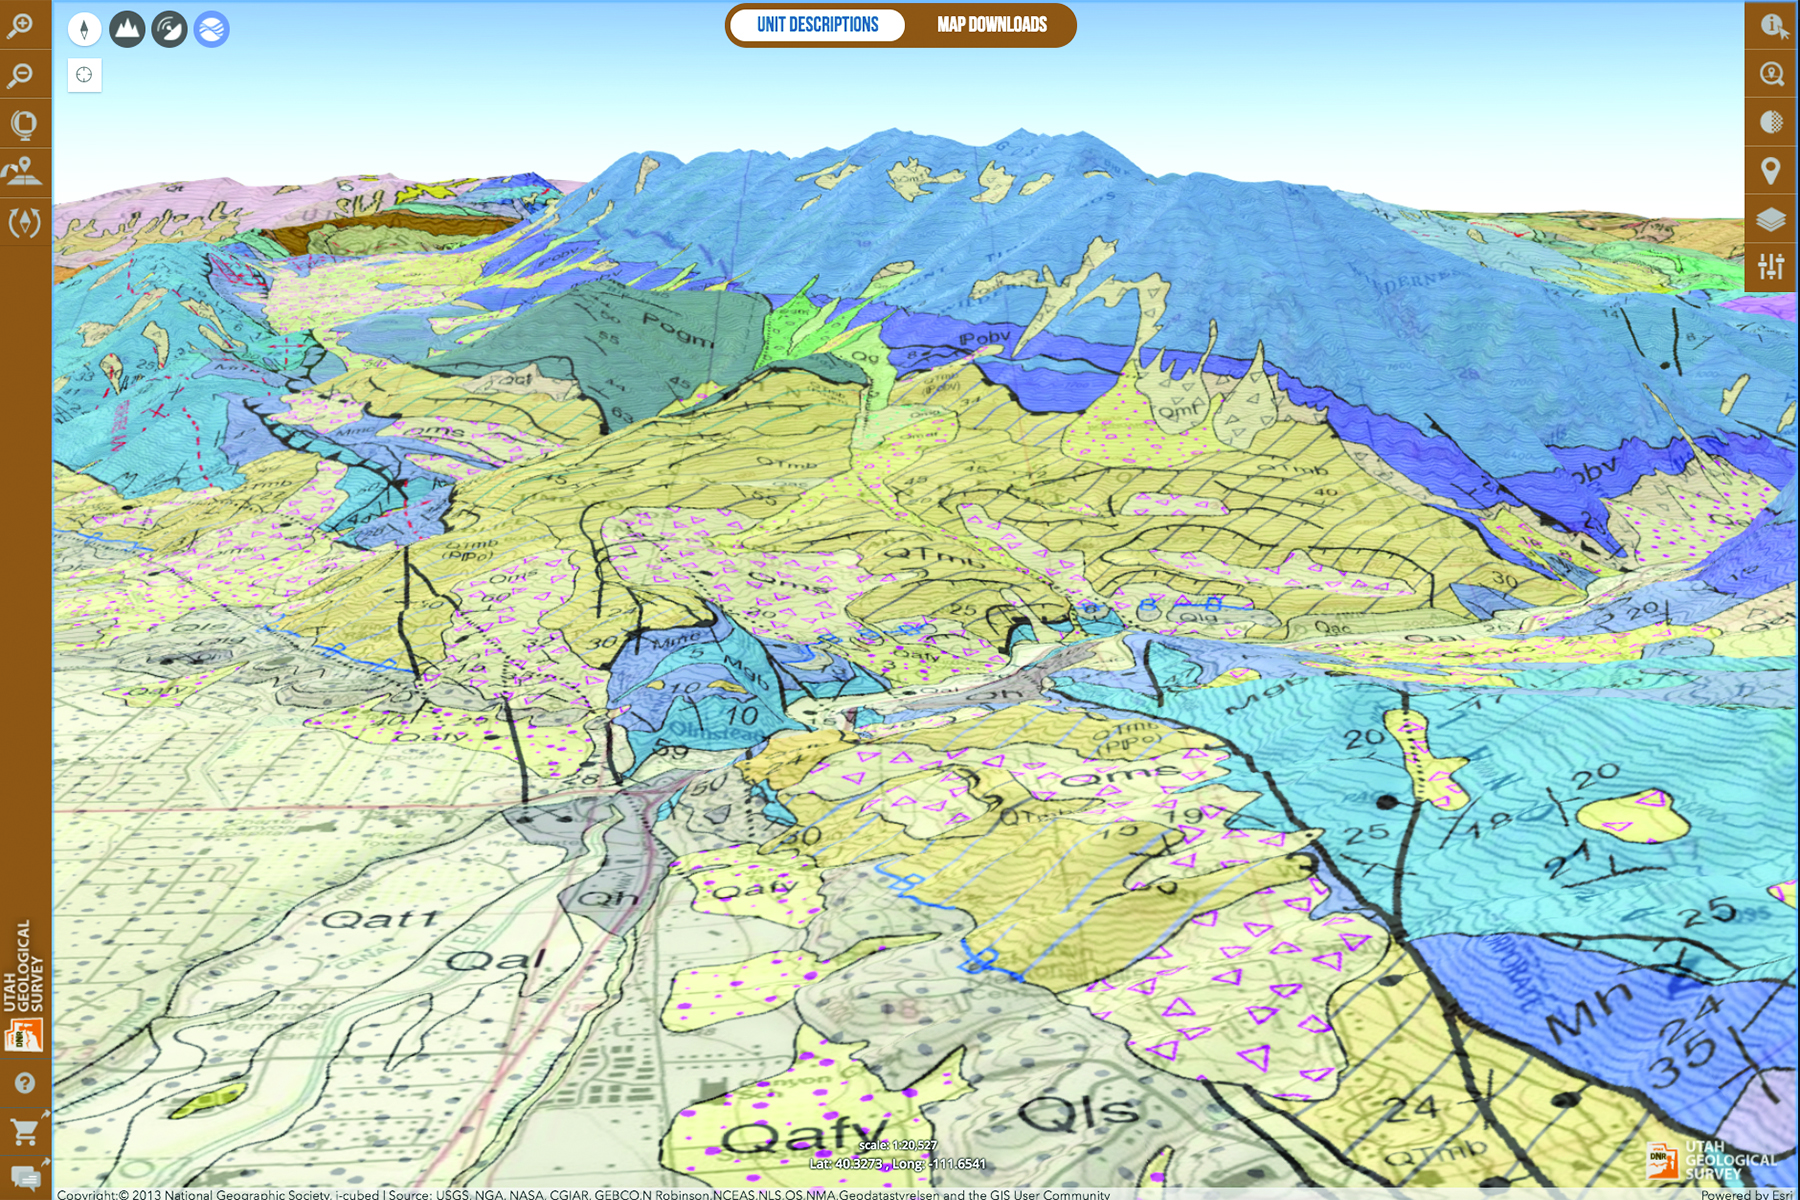
Screenshot of the Geologic Map Portal showing an oblique view of Mt. Timpanogos and Provo Canyon from the south. The 3-dimensional base map allows the user to see the relationship between the landscape and geologic formations (colored polygons), faults (heavy black lines), and ancient shorelines of Lake Bonneville (blue lines).
The Geologic Map Portal was the first interactive map created for the UGS website, and it displays a collection of over 800 of Utah’s best geologic maps. Every geologic map is available for download in various formats, with some of the more recent maps (and all 30′ x 60′ quadrangles) available in a GIS (geographic information system) format. Each colored polygon (which represents a closely related group of rocks, i.e., formations) is clickable, which opens a pop-up showing detailed rock unit descriptions. An improvement to this application came a couple years ago when the 2-dimensional base map was converted to a more true-to-life 3-dimensional base map. This improvement allows the user to tilt and rotate the map to see the rock units in a way that helps them better understand the relationship between geology and landscape. Elementary school teachers and college professors alike can take advantage of this new visual aid to help them teach their students geology in both the classroom and field. Although experiencing geology in person and in the field is probably the best way to understand difficult geologic concepts, our interactive map can certainly add to the experience as it allows you to see the geology of any given location in Utah whenever you want.
In the past 10 years, the UGS has built over 20 interactive maps focused on many aspects of geology. Some of the more useful applications for teachers are centered around popular geology, geologic hazards, and energy and mineral resources. Every interactive map we have created is on the UGS Interactive Maps web page, but a brief summary of some of our more helpful interactive maps follows.
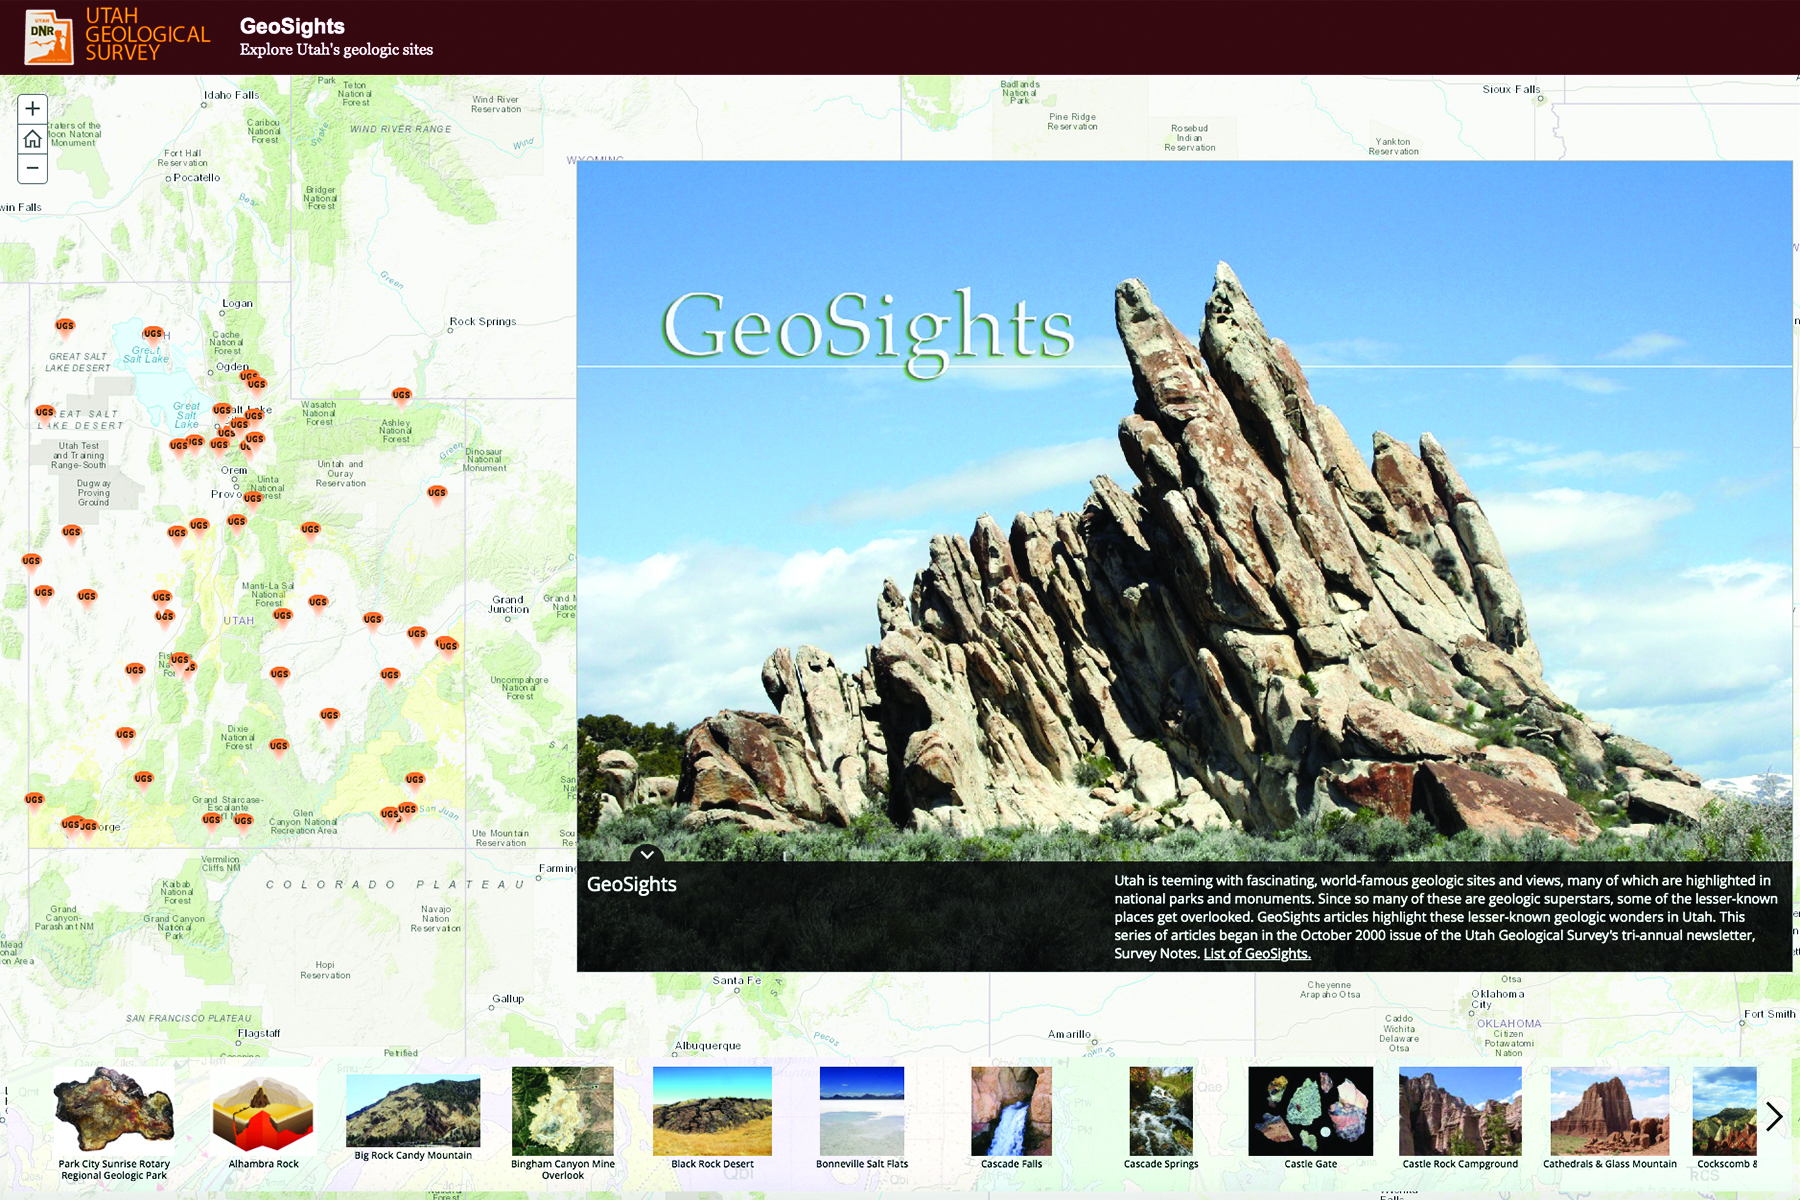
Screenshot of the GeoSights interactive map. Here, people can find many of Utah’s very unique geologic wonders.
Popular Geology
(click on “Popular Geology” filter on Interactive Maps web page):
This option is for those looking for more “general information” interactive maps. These maps give detailed information about rockhounding, fossil sites, pretty landscaping rocks, and fascinating geologic sites throughout the state (called GeoSights). These interactive maps are a great resource for finding and understanding some of Utah’s more fun geologic resources.
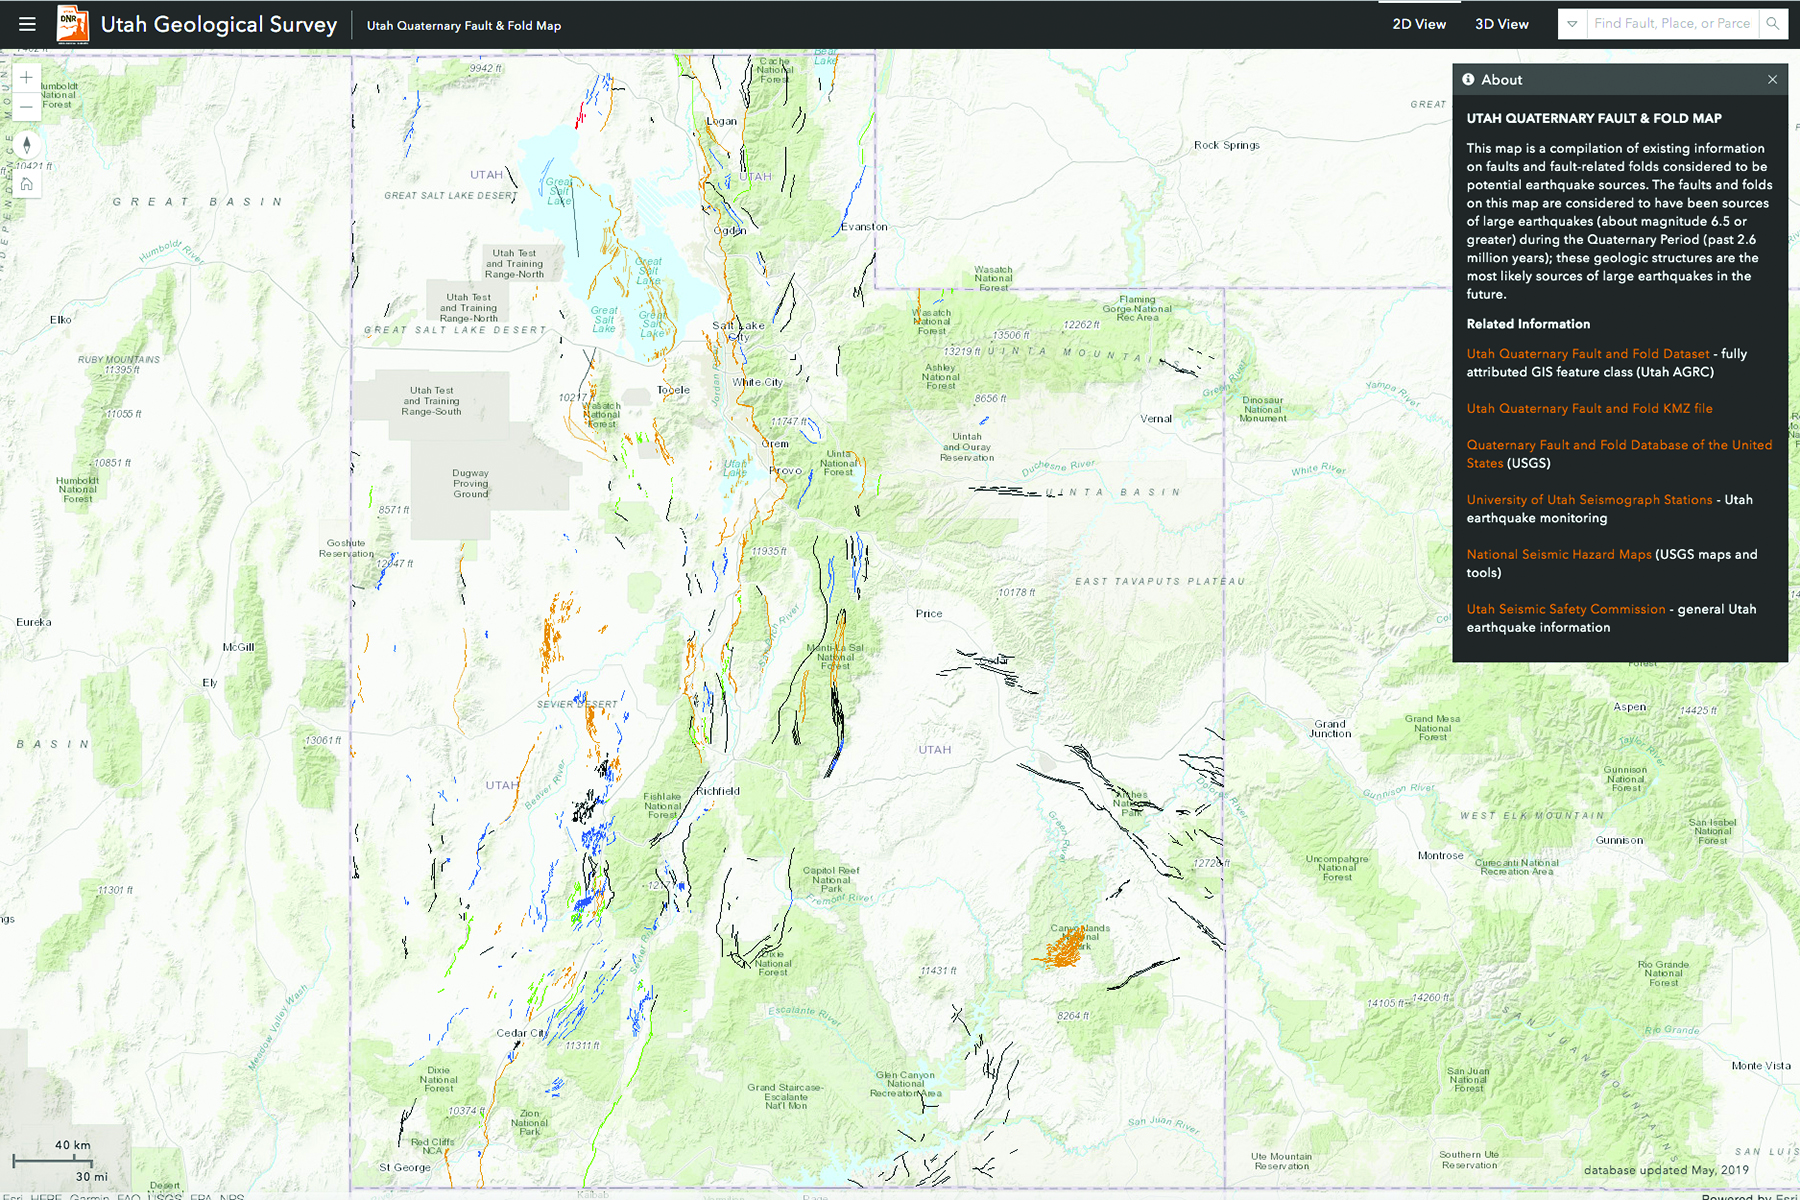
Screenshot of the Utah Quaternary Fault & Fold Database interactive map. The different line colors correspond to how recently the fault last moved and ruptured the ground surface, generating a large earthquake.
Geologic Hazards
(click on “Hazards” filter on Interactive Maps web page):
The Utah Quaternary Fault & Fold Database map shows all of Utah’s active faults. On this interactive map one can find if their home or prospective home is near a fault line. The lines on this map represent faults generally considered to be likely sources of large earthquakes (about magnitude 6.5 or greater). Additionally, a more all-inclusive hazards application is being developed that will display all available geologic hazard data in one interactive map.
Though it is not a true interactive map, we also provide an interactive “story map” of Large Earthquakes on the Wasatch Fault. This teaching tool is great for anyone looking to gain a general understanding of Utah’s most hazardous fault system as you can scroll through and learn when large earthquakes have occurred on the Wasatch fault over time in addition to how we have gathered this information.
Energy Resources
(click on “Energy Resources” filter on Interactive Maps web page):
Many teachers may not know that the UGS houses rock core samples and cuttings from thousands of oil and gas wells in a large warehouse building known as the Utah Core Research Center. We created an interactive map to display all of the data from each well in a user-friendly format. These data include information about well location and depth, rock type, and, in some cases, high-resolution photos of the core. Another useful resource map is about Utah’s mining and industrial resources. This new interactive map shows where all of Utah’s mining districts are located as well as where limestone, gypsum, dolomite, and bentonite resource potential is best in Utah. Seeing the location of these mineral resources is an important step in learning the geologic history of Utah because specific minerals are found in specific geologic environments (for more information on this topic, see the “Glad You Asked/Teacher’s Corner” article in the September 2018 issue of Survey Notes).
The UGS website has interactive maps for a broad audience. Everyone from amateur rock-hounders to teachers to researchers and consultants will find valuable data in our interactive maps. Other UGS interactive maps cover topics ranging from geothermal and wetlands data to groundwater and mineral resources. We continue to work hard on providing the most up-to-date and accurate data in the most user-friendly way possible.