The Wasatch Fault from Above: Re-mapping the Wasatch Fault Zone Using Airborne High-Resolution Topographic Data
By Emily Kleber
About the Author
Emily Kleber

Emily Kleber, Hazards Mapping Geologist
Emily Kleber is a Hazards Mapping Geologist for the UGS where she has worked since 2016. She has degrees in geology from University of California–Davis and Arizona State University. Emily has expertise with high-resolution topographic data from her work with the National Science Foundation-funded lidar project OpenTopography. She is passionate about helping people understand geologic hazards in Utah through her work with the UGS as well as adjunct teaching at Salt Lake Community College and Westminster College.
In 1883, the celebrated pioneer of Utah geology, G.K. Gilbert, wrote a letter to the Salt Lake Daily Tribune warning residents of Utah’s shaky past. In this letter, he indicated the massive elevation difference between Salt Lake Valley and the peaks in the Wasatch Range as evidence for a prolonged history of geologic uplift of the mountains and down-dropping of the valley floor from earthquakes. He noted that this is a regional pattern throughout the Great Basin, where mountain ranges are flanked on either side by valley floors and often have evidence of recent earthquake activity. “When an earthquake occurs, a part of the foot-slope goes up with the mountain, and another part goes down (relatively) with the valley. It is thus divide, and a little cliff marks the line of division. This little cliff is…a ‘fault scarp’ and the earth fracture which has permitted the mountain to be uplifted is a ‘fault’.” Gilbert warned that fault scarps along the western base of the Wasatch Range in Salt Lake Valley were evidence of large surface-faulting earthquakes that had occurred before pioneers settled in Utah in 1847, and more would occur in the future.
Gilbert was observing the central segments of what we now call the Wasatch fault zone. This zone consists of a series of normal faults in ten active segments along a 250-mile-long stretch from north of Malad City, Idaho, to south of Fayette in central Utah. The Wasatch fault zone is one of the best studied continental normal-fault zones on Earth. Although the Wasatch fault has been previously mapped, much of the mapping is spatially coarse and not at the accuracy needed for effective land-use and geologic-hazard ordinances. A recent cooperative grant between the Utah Geological Survey (UGS) and the U.S. Geological Survey’s National Earthquake Hazards Reduction Program is providing funding to re-map the Wasatch fault zone in greater detail using recently acquired lidar (light detection and ranging) data and historical aerial photographs. This higher resolution mapping better fits the demand of modern GIS analysis and mapping, as well as current and future development along the Wasatch Front.
Mapping from Above
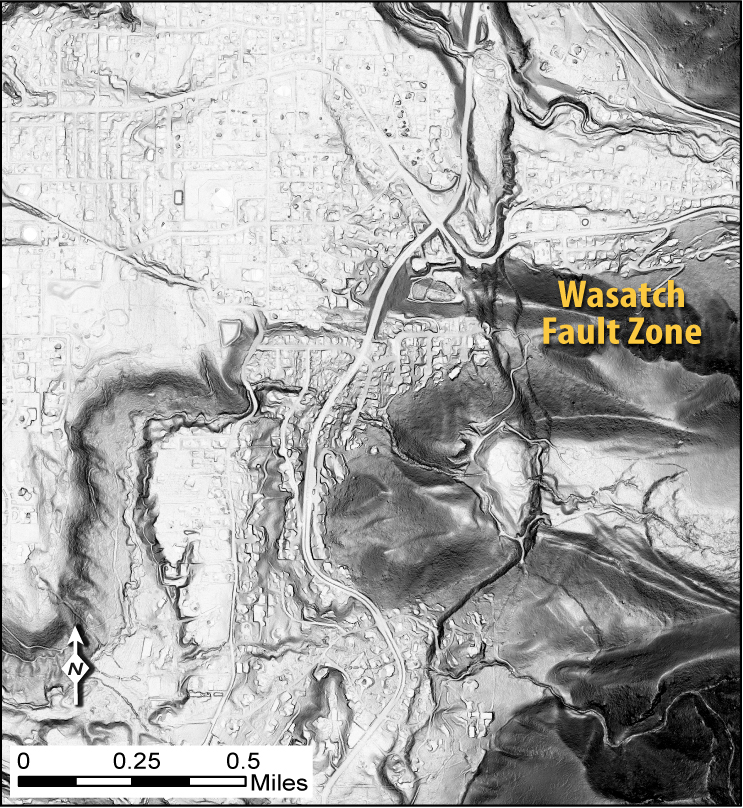
Lidar is a remote sensing technique that has recently revolutionized how earth scientists study the interaction of earthquakes and surface processes over time. Lidar is similar to radar or sonar, but instead of radio or sound waves measuring distance, pulses of laser light are emitted from a sensor and reflected off various things on the Earth’s surface. The amount of reflected light and timing of the laser pulse return to the sensor can be calculated to represent what the laser pulse hit, for example vegetation or buildings, and gives a precise location of that point, with less than half-inch accuracy. These data are commonly collected from an aircraft that flies in a lawn mower-type pattern to completely cover an area of interest. The result of this airborne survey is millions to billions of elevation points that can be classified based on the reflection of the laser light pulse from the aircraft-mounted sensor. This classification enables geologists to remove points classified as buildings, vegetation, or infrastructure, and focus on the shape of the land surface that has been modified by geologic processes.
From 2011 to 2014, a partnership with local, state, and federal agencies funded the collection of over 3000 square miles of airborne lidar data along the entire active Wasatch fault zone including Salt Lake and Utah Valleys. This dataset has more than 40 billion lidar points! These data are being used for several local, state, and federal projects to better characterize the Wasatch fault zone and improve seismic hazard analysis in the Wasatch urban corridor. These data are available online for free through the National Science Foundation-funded OpenTopography data portal or through the Utah Automated Geographic Reference Center (AGRC).
The mapping for this project includes about thirty 7.5-minute quadrangles along the Wasatch Front in Idaho and Utah as well as the northern part of Salt Lake Valley that includes the West Valley fault zone. The lidar data are used to create three-dimensional models of the ground surface by stripping off vegetation and infrastructure. Once this surface is created, the data can be digitally manipulated to view the surface in meaningful ways to observe the surface geology of the Wasatch fault. Two of the most useful models for these surfaces are a hillshade model, where the sun is modeled at a certain height and direction, and a slope model, where subtle changes in the surface slope angle can be detected.
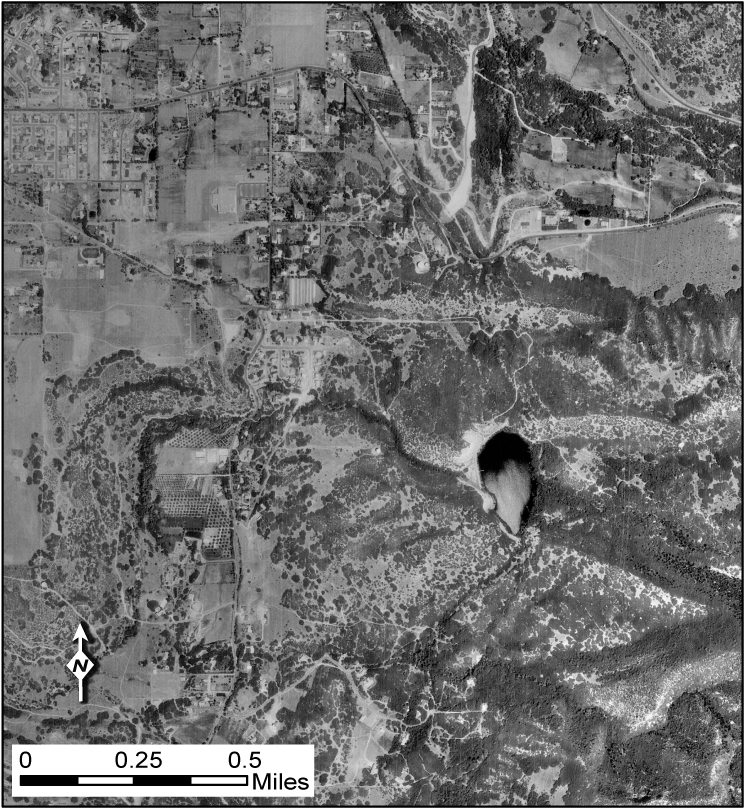
In addition to modern data techniques, an incredibly valuable tool for urban fault mapping is historical aerial photographs. The UGS has an extensive online collection of photographs of Utah from the 1930s to 2014. These photos are critical for urban mapping because they may show the ground shape before being modified by development activities. Additionally, many of these photos were taken in an overlapping pattern called stereo-pairs, allowing them to be viewed in 3D using a special set of glasses. This technique has been used for decades and remains relevant today. Within the UGS Aerial Imagery Collection is a set of historic low-sun-angle stereo aerial photos taken of the Wasatch fault before major development occurred in many areas. Like the hillshading technique used with lidar data, the low sun angle generally illuminates fault scarps clearly, allowing for more accurate mapping of fault traces.
Once the new fault mapping is completed, surface-fault-rupture-hazard special study areas will be delineated along the Wasatch and West Valley fault zones. These buffered zones around the fault traces define areas requiring additional geological and geotechnical investigation to evaluate the hazard from surface faulting prior to development. For well-defined faults that are mapped with certainty, the special study areas will extend 500 feet on the downthrown side and 250 feet on the upthrown side of each fault trace. For buried or inferred faults, the special-study areas will extend 1000 feet on each side of the suspected trace of the fault. These special-study areas are critical to the success of municipal and county geologic-hazard ordinances dealing with hazardous faults, as well as understanding surface-faulting hazard and associated risk.
More information
UGS Geological Hazards Investigation Guidelines
LiDAR: Valuable Tool in the Field Geologist’s Toolbox, Survey Notes, January 2015
Survey Notes, v. 49 no. 3, September 2017


