Tracking Utah’s Ground Motion From Space Using InSAR: A New Tool at Hand
by Tara Shreve
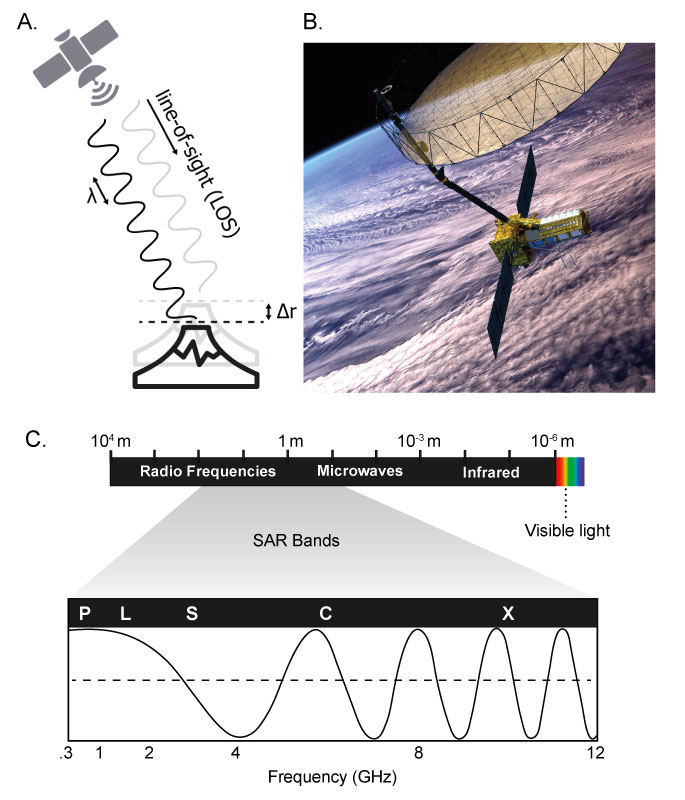
A. Cartoon showing the satellite line-of-sight (LOS) and an emitted radio wave at two different times (black and gray). If the ground has moved between those times, a phase difference will correspond to a certain amount of motion towards or away from the satellite (LOS displacement). As a result, ground displacement measurements from InSAR are a combination of vertical and horizontal motion. The known wavelength (λ) of the radio wave helps convert the phase difference to a measure of length. B. An artist’s depiction of the NASA-ISRO NISAR satellite. Credit: NASA/JPL-Caltech, NISAR Satellite in Earth Orbit (Artist’s Concept). C. A chart of wavelength values, highlighting some of those used in SAR missions (L, S, C, and X-bands, with wavelengths of ~24 cm, 10 cm, 5 cm, and 3 cm, respectively). Longer wavelengths can penetrate through vegetation, but they are less sensitive to small ground displacements. Modified after NASA Synthetic Aperture Radar (SAR) Data Basics.
In 2024, the UGS began to systematically use a satellite-based technique, called InSAR (Interferometric Synthetic Aperture Radar), to measure ground motion throughout Utah. To understand how InSAR works, imagine you’re walking through a remote canyon. You may notice that the only sound to break the landscape’s silence is the echo of each footstep. The delay between your steps and the echo conveys how far the sound has traveled before reflecting off the canyon wall back towards you. This delay, and the speed of sound, is all you need to figure out the distance to the canyon wall. Instead of using acoustic wave echoes, scientists can use electromagnetic wave “echoes” to measure ground motion from satellites orbiting more than 400 miles above our heads.
A brief history of InSAR
Electromagnetic waves—radiant energy travelling close to the speed of light—also bounce off surfaces. In this case, the reflection is called backscatter and is the basis for radar systems. Radar stands for “RAdio Detection And Ranging,” and is commonly used for weather monitoring. Weather radar emits radio waves (electromagnetic waves with wavelengths reaching up to miles), which bounce off ice or water droplets in the atmosphere. We can determine the distance to a storm (precipitation location), as well as the precipitation velocity and intensity, by recording the time it takes for the waves to travel back to the radar antenna and analyzing how the radio wave characteristics have changed over that time.
Since radar is a useful tool for locating and tracking objects like storms, why not use it to map features on the Earth’s surface? This thought crossed scientists’ minds in the first half of the 20th century. Initially, they encountered technical challenges, such as poor spatial resolution of these radar-generated images. To obtain resolution sufficient for distinguishing objects on the ground, a technique called synthetic aperture radar (SAR) was developed in the 1950s. The first SAR satellite, QUILL, was launched in 1964 by the United States National Reconnaissance Office, and it had a spatial resolution finer than 17 feet (~5 meters). One of the biggest advantages of a SAR satellite is that it provides its own illumination through a radar pulse. It can acquire images during the day, at night, or in cloudy conditions, as opposed to optical images from satellites or aircraft that rely on sunlight.
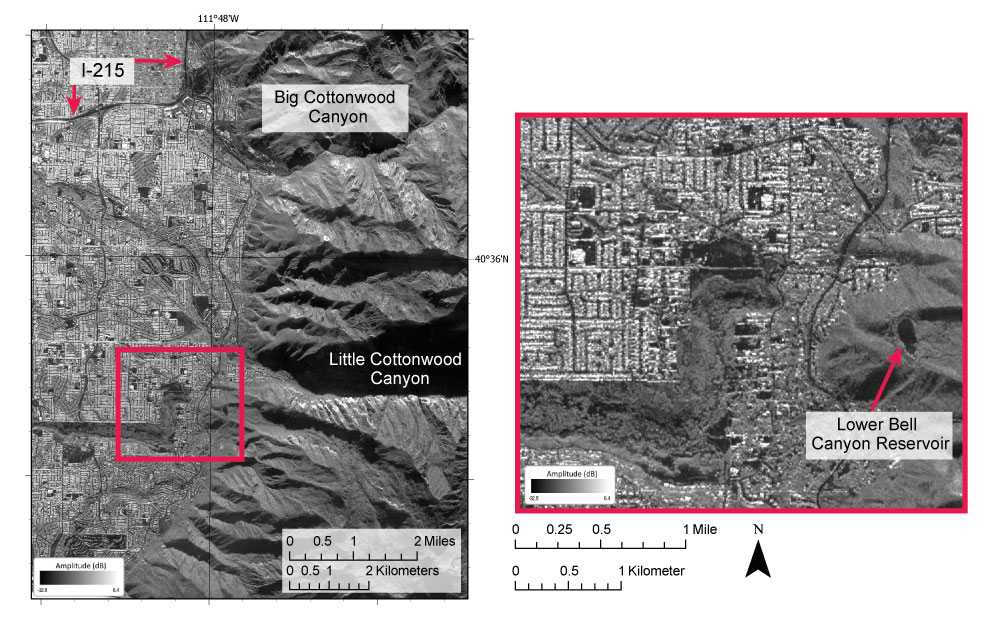
SAR amplitude image of eastern Salt Lake Valley that demonstrates the ability to distinguish between buildings, roads, and small topographic features. Image acquired from the airplane-mounted UAVSAR on March 16, 2021. The spatial resolution is 7 by 5 meters (23 by 16 feet), and similar spatial resolution can be achieved by some civilian SAR satellites. Amplitude brightness depends on multiple factors, including material properties and surface roughness. As a result, grassy fields and bodies of water appear dark, whereas metallic surfaces such as building roofs are light gray or white. In the Wasatch Range, steep topography blocks radar waves emitted from the radar antenna, causing the shadowed regions. This shadow is due to the angle at which the antenna views the ground (side-looking). UAVSAR data courtesy NASA/JPL-Caltech and the SnowEx 2021 Western US campaign.
With this new tool, scientists wanted to know if they could move beyond imaging the Earth’s surface to measuring ground motion. A SAR image is created from an electromagnetic wave, and, as with any cyclic wave, at a given time, it has both an amplitude (the wave’s energy) and a phase (the wave’s position in its cycle). The phase changes with time as the wave travels towards the Earth. By comparing two SAR images acquired from nearly the same satellite position on different days, a change in phase can be related to ground motion, which results in a change in distance between the satellite and Earth. This change could be due to earthquakes, landslides, volcanic eruptions, or other geologic or human-related processes. Finding the phase difference between two days at any point in the SAR image will measure how far the Earth’s surface has moved away from or towards the satellite “line-of-sight,” or LOS. The proof-of-concept for this technique, called Interferometric SAR (InSAR), occurred in the 1970s and ‘80s. Applications of the technique were later expanded after the launch of the European Space Agency’s ERS-1 satellite in 1991.
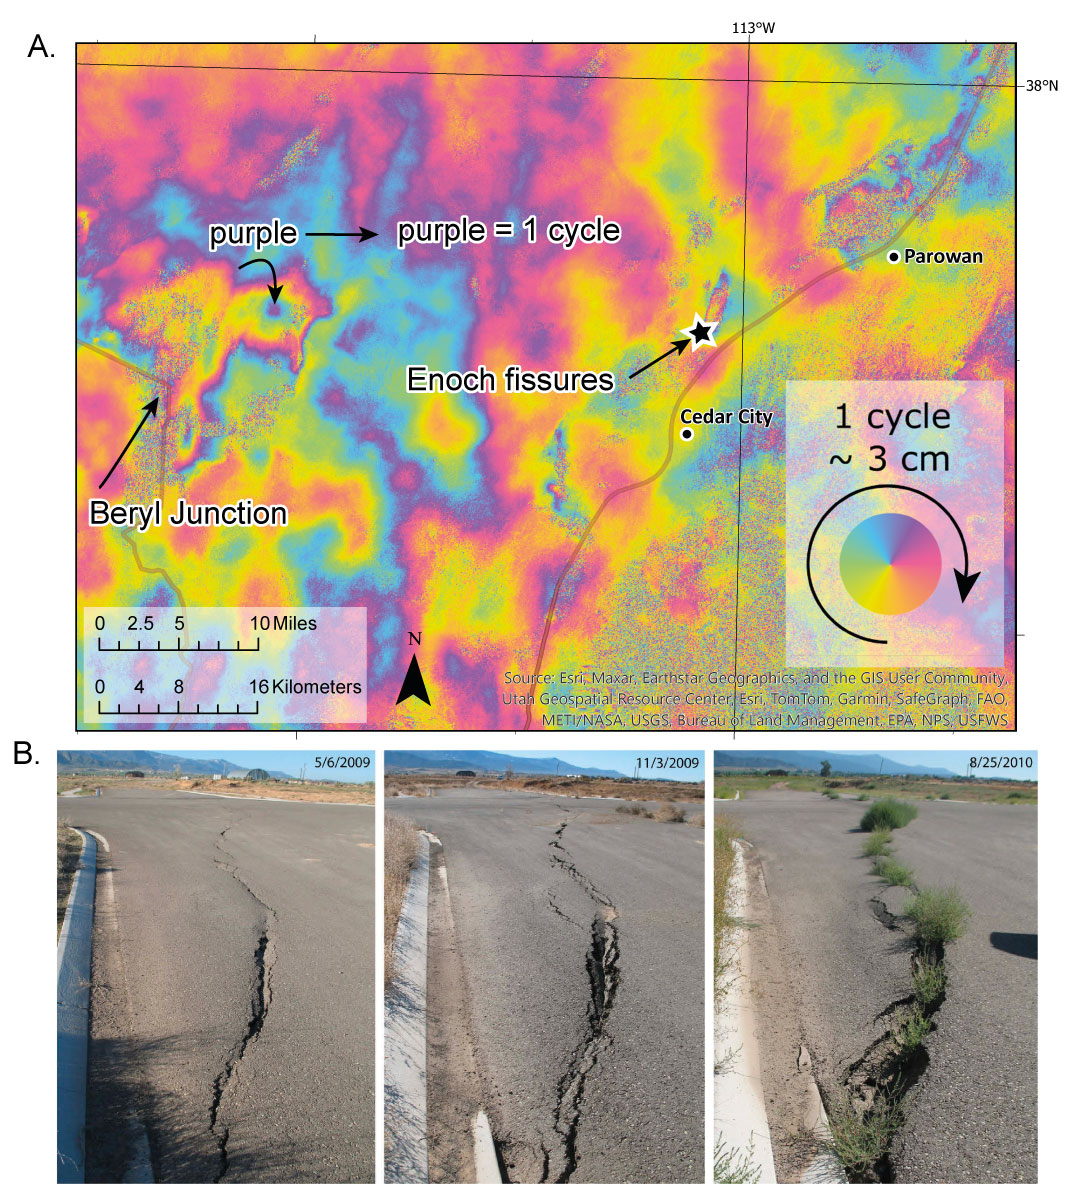
A. Wrapped interferogram of southwestern Utah, near Cedar City, from ESA’s SAR satellite Sentinel-1. This interferogram spans October 13, 2023, to July 27, 2024. One full cycle of color (e.g., purple to pink to yellow to blue to purple) is about 1.1 inches (2.8 cm) of ground motion away from the satellite during that time. The visible cycles near Beryl Junction, Enoch City, and Parowan are related to land subsidence due to excessive groundwater withdrawal. Continued land subsidence can result in earth fissures, as shown in the bottom panel. Pixelated areas indicate no reliable data. Sentinel-1 data ©2023, 2024 European Space Agency. B. Time sequence photo comparison showing progressive damage to pavement in the Parkview subdivision in Enoch City, Utah, due to land subsidence.
The golden age of (In)SAR
Since 1991, more than 15 civilian SAR satellite missions have been launched in collaboration with national space agencies, and at least 9 were still operational in 2024. These satellites provide global coverage at regular or semi-regular intervals (a few days to a few months between images at any given location). In many cases, the satellite images are freely available to the public. Spatial resolution varies from 3 feet to 10s of feet (a few meters), which is fine enough to distinguish buildings. There are also commercial SAR companies, which have launched groups of small SAR satellites to provide images more frequently and with higher spatial resolution (3 feet [1 meter] or less, which can distinguish between vehicles). SAR can also be mounted aboard planes, as is being done with the Uninhabited Aerial Vehicle Synthetic Aperture Radar (UAVSAR). This radar system, operated by NASA’s Jet Propulsion Laboratory (JPL), is flown on an autopiloted Gulfstream-III (G3) jet. This approach provides more control over the flight path and finer detailed imaging (a few feet [meter-scale] spatial resolution).
In 2025, NASA and ISRO (Indian Space Research Organisation) plan to jointly launch the NISAR satellite that will provide yet another opportunity to expand the already extensive archive of freely available SAR images.
SAR sensors, complementary to other earth observation satellites and imaging techniques, have a plethora of applications. They have improved disaster response and hazard mitigation, advanced scientific understanding of earthquakes and volcanoes, and inspired governments, academia, and private companies to continually improve and apply this technology in the future.
InSAR applications at the UGS
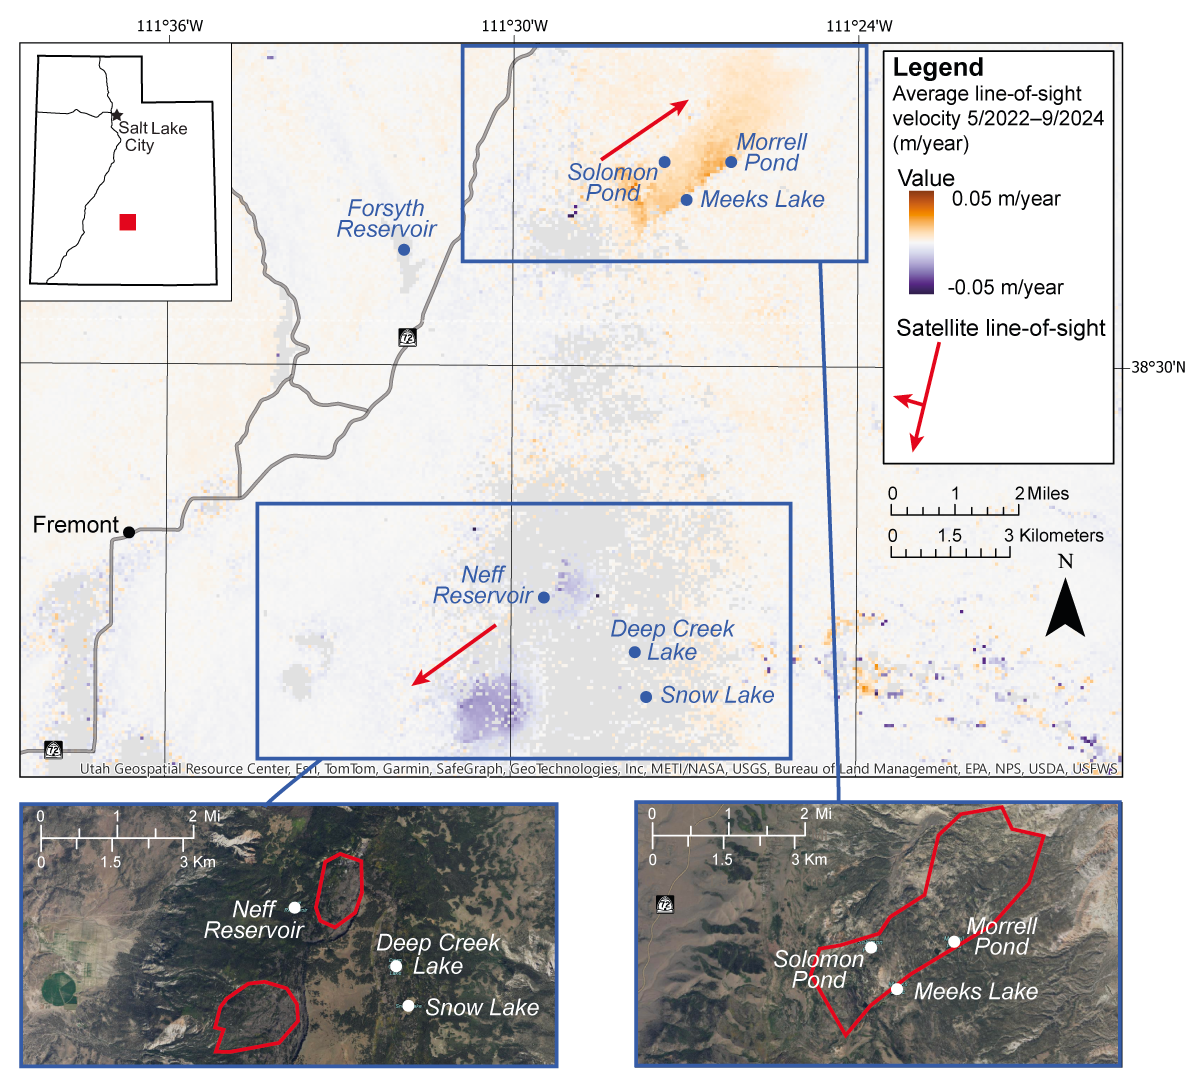
Average LOS ground motion velocity in central Utah estimated from Sentinel-1 interferograms spanning May 2022 to September 2024 (Sentinel-1 data ©2023, 2024 European Space Agency). The colorbar ranges from -5 to 5 cm/year (about -2 to 2 inches/year), and pixels with low reliability are masked. Two distinct regions of LOS ground motion are shown with blue rectangles. This motion is related to two landslide complexes, outlined in red in the bottom panels, showing optical satellite images. The northernmost landslide, near Meeks Lake, is moving toward the satellite, while the bottom landslides, west and northwest of Thousand Lakes Mountain, are moving away from the satellite. Imagery from the National Agriculture Imagery Program (NAIP), Esri, USDA Farm Service Agency.
Recently, the Utah Geological Survey (UGS) received federal and state funding to apply InSAR to monitor ground motion throughout Utah. The main focus is to identify potential areas of land subsidence, or sinking, caused by excessive groundwater withdrawal due to human activities. If more groundwater is pumped from an aquifer than is recharged by surface water, the water pressure in the underground pore space is reduced, allowing the aquifer sediments to compact. This sediment compaction causes land subsidence and, in addition to potentially causing damage to buildings and infrastructure, may permanently decrease the amount of water an aquifer can store. In turn, this results in lower water availability when surface water becomes scarce. In the U.S., 38% of water usage comes from groundwater. This number increases during periods of drought, such as the 2021–2023 extreme drought in Utah, which affected most of the state. A previous UGS study focused on measuring subsidence in southwestern Utah due to excessive groundwater pumping. This study found that subsidence in Cedar City Valley produced more than 8 miles of ground cracks, or fissures. According to historical aerial photographs, the first fissures began appearing in the 1960s. To help preserve the physical integrity of the aquifer, the Utah Division of Water Rights developed and adopted the Cedar City Valley groundwater management plan in 2021 to gradually reduce groundwater withdrawals. Moving forward, the increase in SAR data and improved processing techniques will allow for a systematic, semi-automatic analysis of InSAR data for monitoring land subsidence in Utah. Similar to Arizona and California, the UGS will routinely utilize and interpret InSAR data and provide the results to the public.
InSAR can also be used to monitor other geologic hazards, such as earthquakes and landslides, that are prevalent in Utah. The 2020 Magna earthquake caused more than $62 million in damages, and the Wasatch Front has greater than a one in two chance (coin toss) of a magnitude 6.0+ earthquake in the next 50 years. If another earthquake with a magnitude 5 or above were to occur in Utah, comparing SAR images acquired before and after the event could quickly identify ground ruptures or disturbances and inform damage assessments. In addition, landslides can cost Utah millions of dollars in damages per year. To assist in mapping and tracking landslide motion, which often occurs at rates as slow as a few inches per year, we can use InSAR to identify and monitor moving slopes over the course of weeks or years. This dataset will complement field mapping and ground-based measurements using GNSS (Global Navigation Satellite System). Other sources of ground deformation in Utah that have rates well-suited for InSAR (a few tenths of an inch to a few inches per year) include ground deformation from mining, oil and gas extraction, geothermal-related subsurface changes, and motion of rock glaciers (masses of ice covered in rocks that move downhill). The UGS plans to leverage SAR datasets through collaborative projects across its programs to monitor ground surface changes throughout the state.
ABOUT THE AUTHOR
Tara Shreve
is an Interferometric Synthetic Aperture Radar (InSAR) Specialist who joined the Utah Geological Survey in 2024. She has a B.S. in mathematics and graduated with a Ph.D. in geophysics from the Institut de Physique du Globe de Paris in 2020, with a focus on InSAR geodesy. She has applied InSAR to identify, interpret and model ground deformation at remote volcanoes in Alaska, Vanuatu, Democratic Republic of Congo, and the Galápagos. Her work with the UGS is to monitor different geologic processes that drive ground displacement throughout Utah, such as land subsidence, landslides, and earthquakes.


