Mapping and Modeling Phragmites at the Bear River Migratory Bird Refuge
by Pete Goodwin and Rebecca Molinari
Phragmites (Phragmites australis ssp. australis) threatens Great Salt Lake wetlands by readily invading shallowly flooded areas to form dense stands extending tens of thousands of acres. These stands replace native vegetation communities, degrade wildlife habitats, and consume additional water through greater evapotranspiration (the water evaporating from leaves during photosynthesis). Understandably, land managers around Great Salt Lake consider phragmites control a top priority and invest significant resources in treatment and eradication.
Effective phragmites control requires accurate vegetation mapping to identify new phragmites stands while clearly distinguishing native vegetation and to delineate possible treatment areas. The Utah Geological Survey (UGS) completed the most recent large-scale phragmites mapping effort as part of a 2014 National Wetland Inventory mapping project, but that mapping is over ten years old. Now, managers need new maps that reflect the current phragmites extent but that also can be easily updatable to keep pace with continuing phragmites expansion and control.
The Utah Division of Forestry, Fire & State Lands (FFSL) recognized this need for updated mapping and is working to develop computer models that identify phragmites across the entire Great Salt Lake watershed. To be successful, these models need to “learn” how to correctly map phragmites. The UGS, in collaboration with FFSL and the U.S. Fish and Wildlife Service (FWS), mapped and modeled vegetation at the Bear River Migratory Bird Refuge (Refuge) to map phragmites for FFSL models and test modeling workflows.
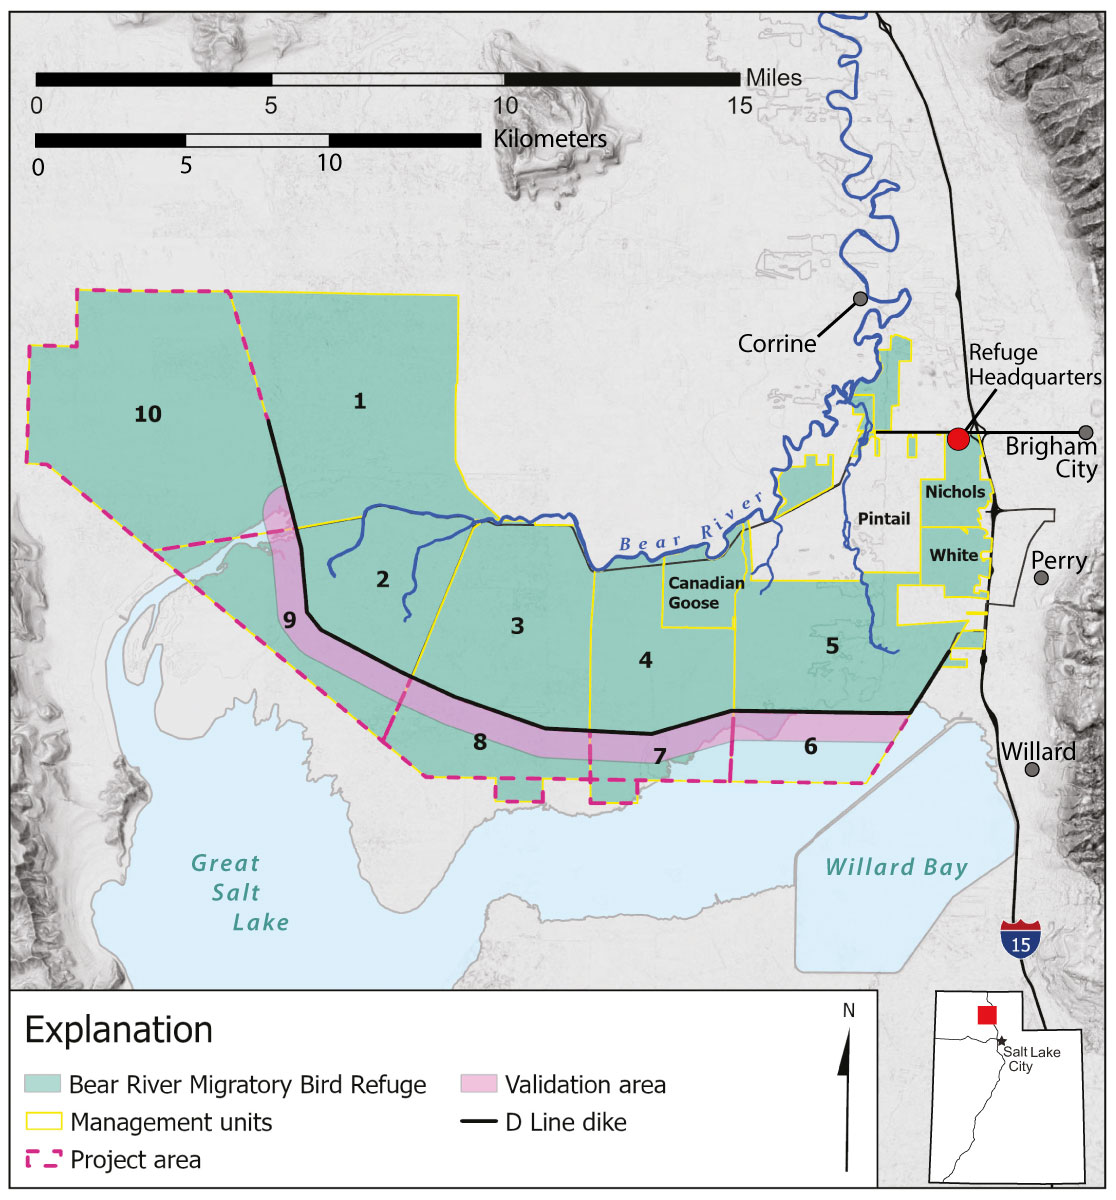
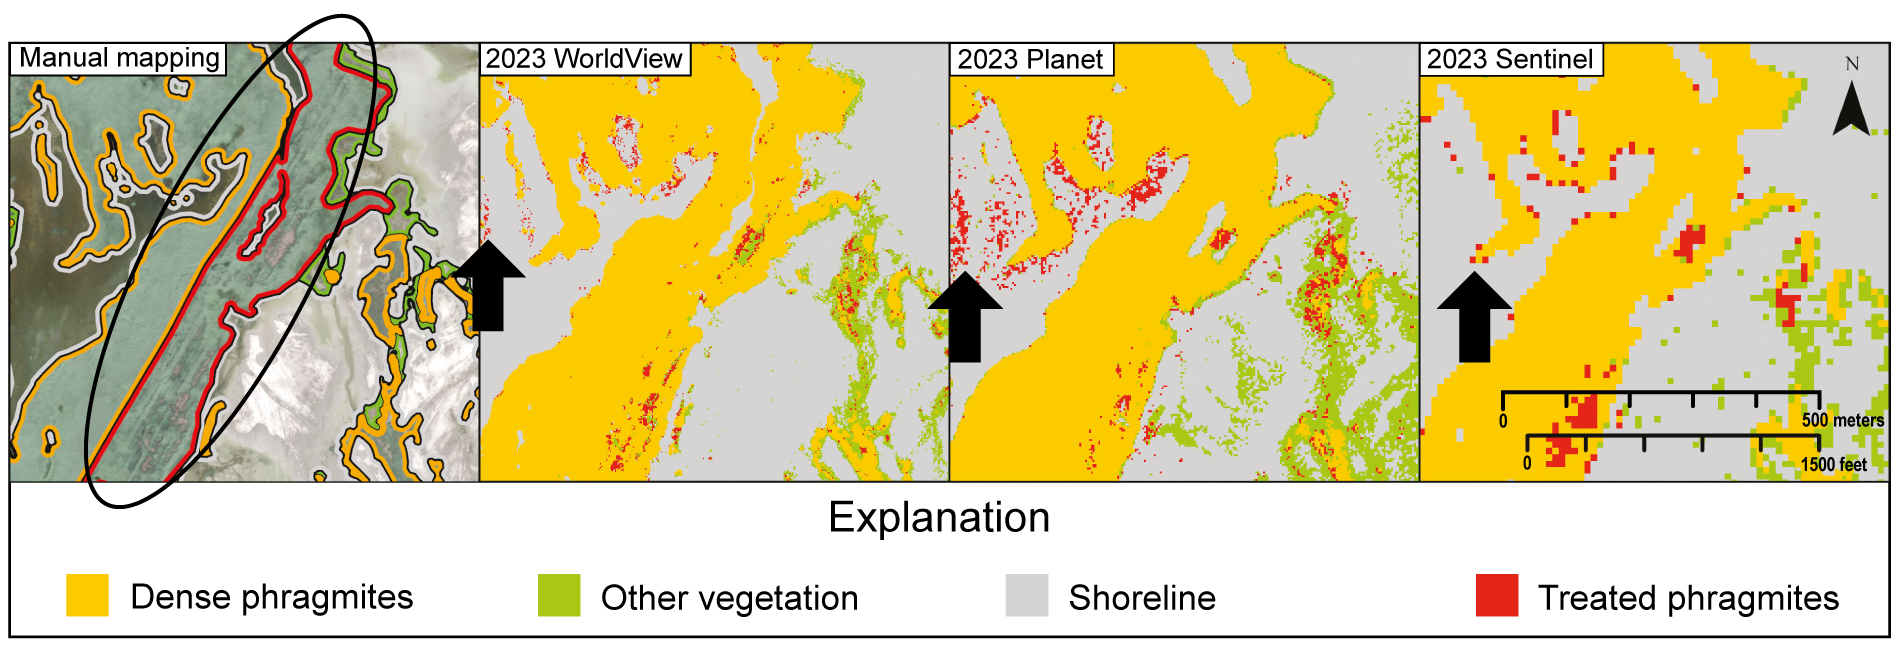
We mapped vegetation on the Refuge using two approaches—a manual photo interpretation using high-resolution imagery collected in July 2023, and an automated approach that developed several models using Random Forest (RF) algorithms classifying satellite imagery. Both approaches classified vegetation into four vegetation communities (dense phragmites, treated phragmites, shoreline, and other vegetation) and completely mapped those communities across the lower part of the Refuge (management units 6, 7, 8, 9, and 10). The manual approach relied on skilled ecologists to delineate each community across the entire project area, whereas the RF models required only a small set of representative mapping, typically referred to as training data. The RF models used the training data to “learn” how to correctly classify individual pixels of satellite imagery to our four vegetation communities.
We developed several RF models from several imagery datasets to test how model accuracy might vary by image resolution or collection date. For the resolution comparison, we developed three RF models from three satellite imagery datasets across a quality and availability spectrum. We used Sentinel (a free and widely available coarse [10 meter] resolution dataset) for a low-cost option, tasked Worldview (a high [2 meter] resolution dataset collected specifically for this project) for a high-cost option, and commercial Planet imagery (moderate resolution [3 meter] available for purchase from several vendors) for a moderate cost option. We selected Planet and Sentinel images closest to the July 20, 2023, WorldView collection date to minimize image variability.
We assessed the accuracy of each approach by evaluating the manual mapping and RF models against reference locations with known vegetation communities, typically referred to as validation data.
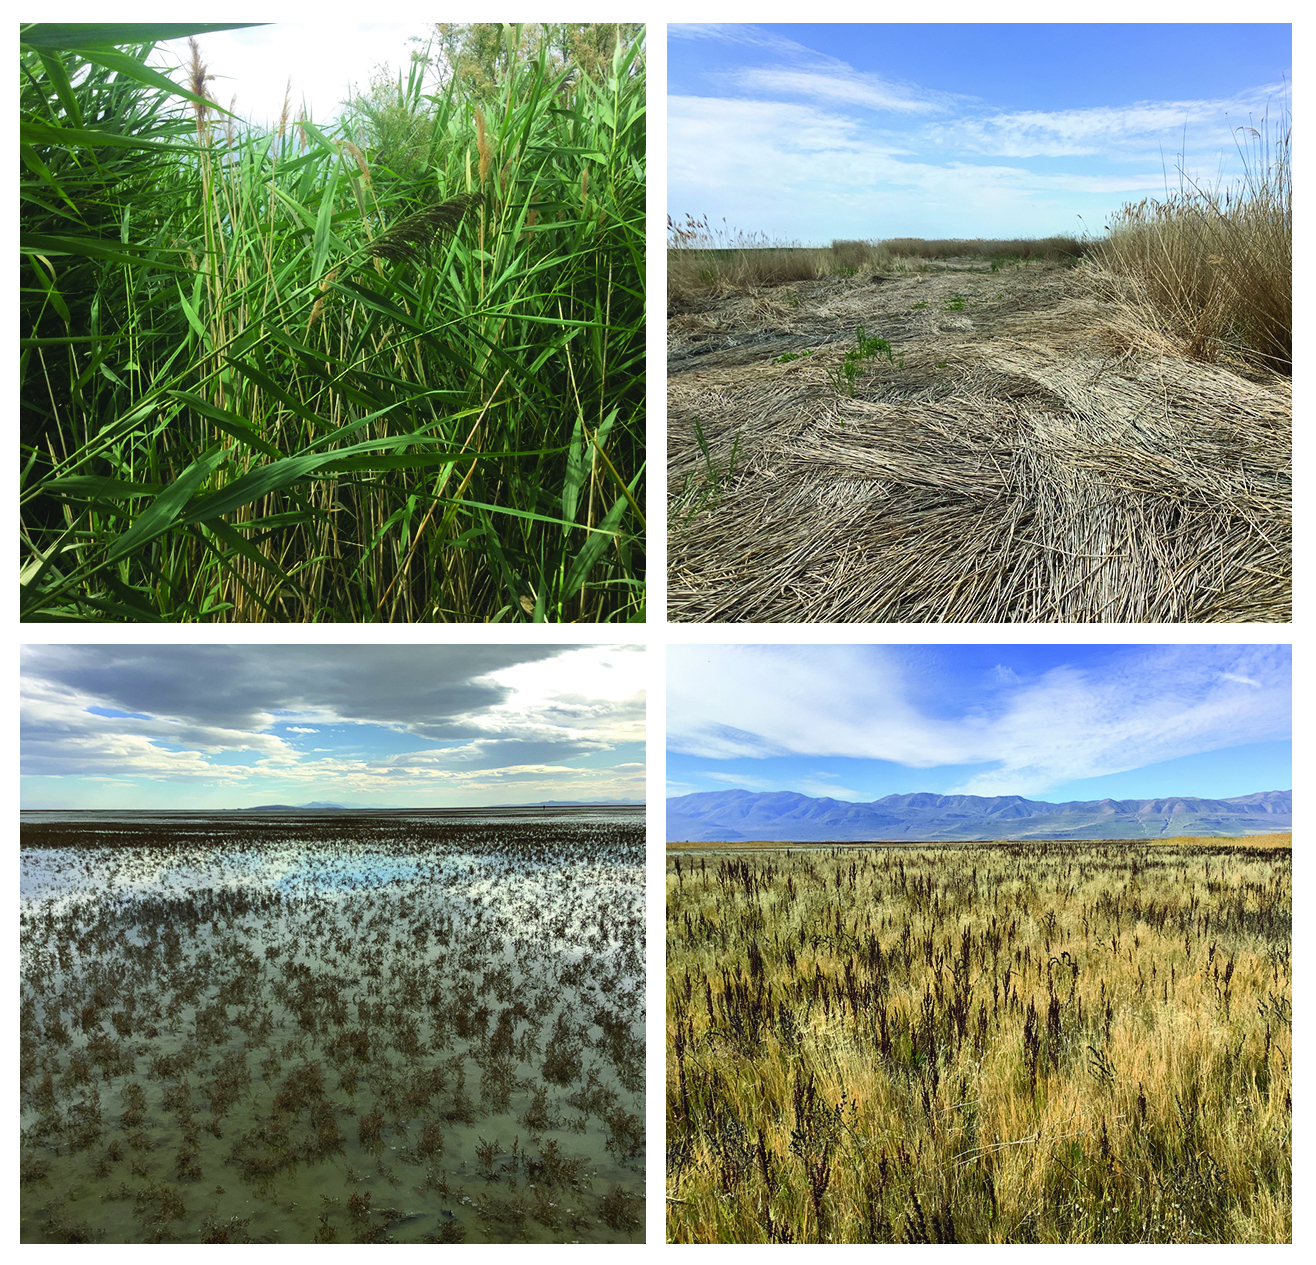
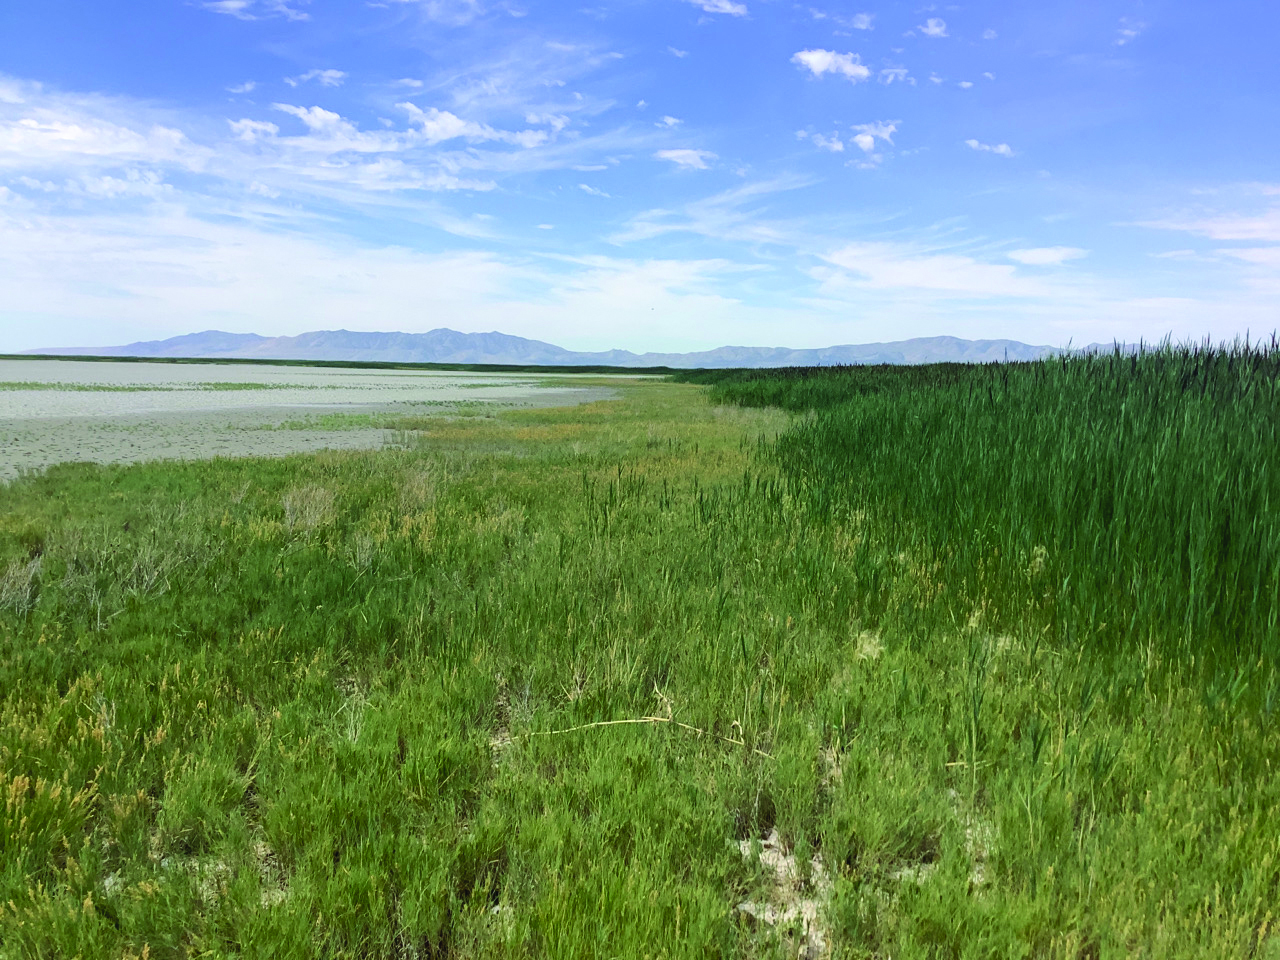
Examples of typical vegetation communities (from left to right). Dense phragmites, treated phragmites, shoreline which included shallow water, barren playas, and sparse pickleweed (Salicornia spp.), and other vegetation which included all native marsh and meadow vegetation.
From the validation data, we determined overall accuracy and specific accuracies for dense phragmites and treated phragmites which we reported as user accuracy and producer accuracy. User accuracy measures how likely a mapped or modeled phragmites stand exists in the field; conversely, producer accuracy measures how likely an existing phragmites stand is included in the mapping or modeling. Useful phragmites mapping must be reliable (high user accuracy) to prevent unneeded effort attempting to treat incorrectly mapped phragmites but also complete (high producer accuracy) to provide managers with accurate estimates of total phragmites extent.
We found varying accuracies between the manual mapping and RF models produced by the manual and automated approaches, but each identified the dense phragmites community with over 80% user and producer accuracies. Some RF models approached 100% user and producer accuracies but had reduced accuracies when validated similarly to the manual mapping. Both approaches mapped treated phragmites less accurately and the RF models mapped this community with substantially lower producer accuracy, i.e., many existing phragmites treatments areas were not mapped as a treated phragmites community. Our RF models and manual mapping differ in several ways. Manual mapping depicted native vegetation communities with more nuance and identified treated phragmites communities more intuitively as impacted phragmites (e.g., dead thatch, mowed tracts, sparse regrowth) within a treatment boundary. RF models require vastly less time and effort and can consistently identify small (less than 400 ft2) phragmites patches. Despite these differences, both approaches accurately identified phragmites stands with very similar boundaries.
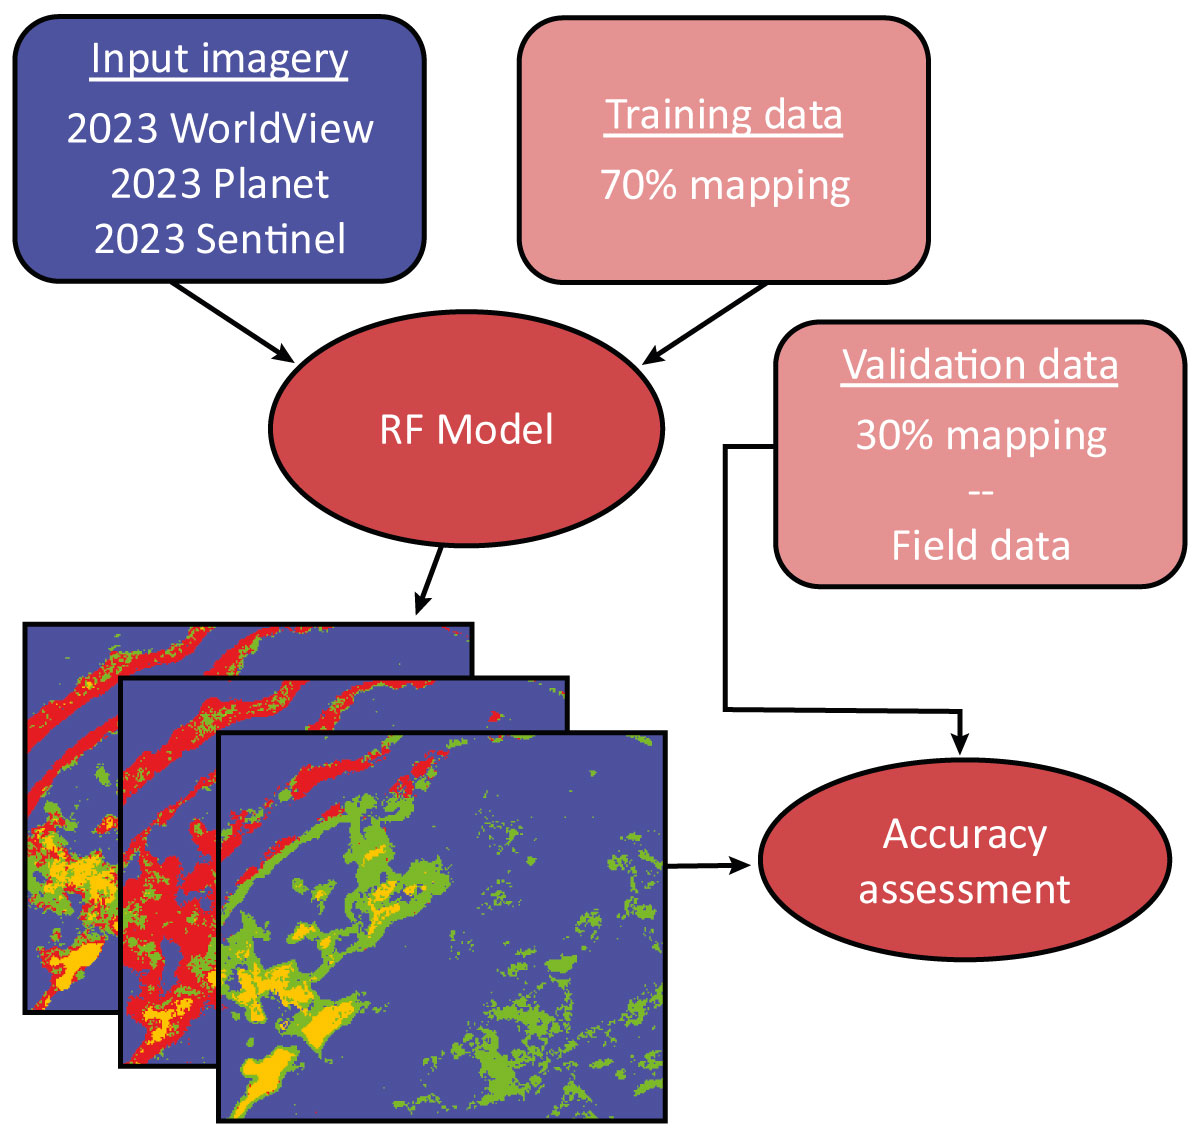
Conceptual diagram of RF model development and assessment for imagery resolution comparisons. Models were trained using 70% of the representative mapping and the remaining 30% used as validation data in accuracy assessments. We also assessed each RF model using field data collected in fall 2023.
Our best RF models relied on high-resolution (2 meter) satellite imagery trained on ample and diverse training data. We noticed accuracy decreased in areas with mixed signatures or those farther from our validation data. For instance, the RF models struggled to classify phragmites intermixed with native marsh vegetation or dense algae because we created training data by mapping very distinct phragmites patches. Additionally, these intermixed areas frequently exist at the southeastern edge of the project area, an area well outside our limited field validation area. Our project area did not include irrigated fields whose dense, green appearance would likely confuse phragmites models. We recommend future studies to examine model effectiveness across a project area containing both phragmites and irrigated fields. We also recommend that annual phragmites models be produced from easily available imagery like Planet or Sentinel to track changes in phragmites location and extent.
Our manual mapping and all RF models identified substantial phragmites infestations on the Refuge, with the dense phragmites vegetation community covering 2,000 to 2,300 acres, or 7% to 8% of the 30,125-acre project area. Within several individual management units (units 7 and 8), phragmites cover exceeded the 10% threshold USFWS set in recent habitat management plans. Although exploratory and highly specific to our project area, we were able to rapidly and accurately model obvious phragmites stands. These results bolstered Refuge staff efforts to fund and complete phragmites treatments in less intensively managed areas on the Refuge. Data produced by this project enabled more specific phragmites control on Refuge lands and laid groundwork for future large-scale phragmites modeling efforts.


