LiDAR—Valuable Tool in the Field Geologist’s Toolbox
By Steve Bowman, Adam Hiscock, Mike Hylland, Greg McDonald, and Adam McKean
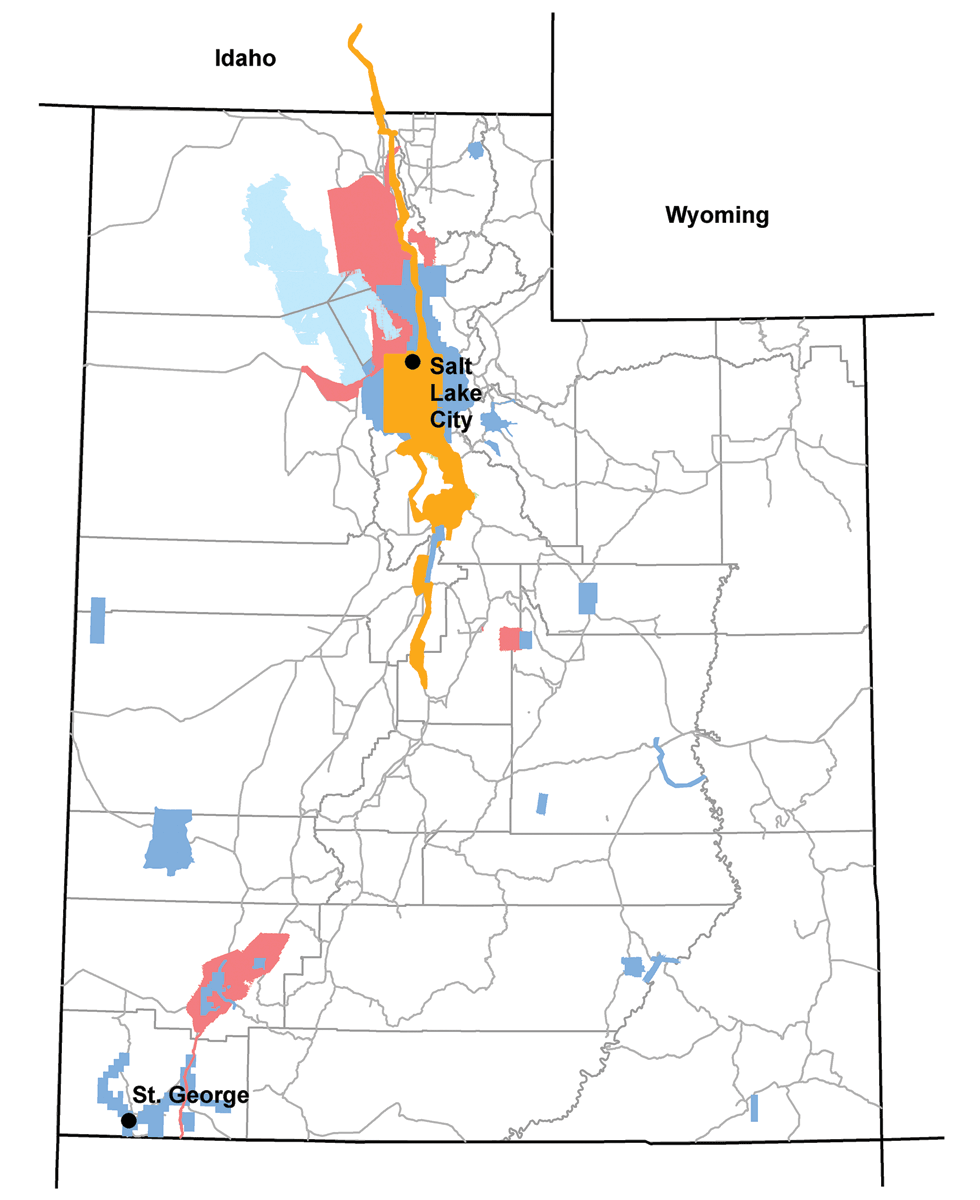
LiDAR data in Utah can be accessed through the following links:
LiDAR Elevation Data, Utah Geological Survey
LiDAR (Light Detection and Ranging) has become one of the most valuable tools for geologists studying the Earth’s surficial processes and landforms. LiDAR is a technique of transmitting laser pulses and measuring the reflected returns to determine the distance to an object or surface. LiDAR data are commonly collected by means of an aerial survey, where a LiDAR instrument mounted on the floor of an aircraft sends pulses at a rapid rate (typically billions of pulses for a project) to determine ground-surface elevations.
Computer processing of the raw LiDAR data, including digital “removal” of vegetation, results in highly accurate, bare-earth digital elevation models (DEMs) of the ground surface. Landslides, small fault scarps, and other geologic features that are difficult to detect visually in the field or on aerial photographs can often be clearly shown on LiDAR-based imagery, allowing for very detailed surficial geologic mapping.
For analyzing large areas, LiDAR has several advantages over traditional surveying methods. The high point-spacing density of LiDAR results in much higher resolution, and the ability to digitally manipulate the data in different ways maximizes the topographic information that can be obtained. LiDAR data can be used to create a hillshade image, which simulates a three-dimensional representation of the ground surface “illuminated” as if the sun was shining on it from a particular location in the sky. The location of the “sun” (both its azimuth, or compass direction, and its vertical angle above the horizon) can be selected to highlight topographic features having a particular trend across the landscape.
Other LiDAR-derived images useful for mapping landforms include slopeshade images, which indicate slope steepness, and surface-contour (topographic) maps, where the contour interval (vertical distance between adjacent contour lines) can be selected to best illustrate the topography. In addition to surficial geologic mapping, the versatility of LiDAR data lends itself to numerous other applications such as watershed analysis, vegetation analysis, wetlands mapping, land-use planning, and others.
The Utah Geological Survey (UGS) and its various partners have been acquiring high-resolution LiDAR data across Utah in support of geologic mapping and other research projects, including 1-meter data in 2011 and 0.5-meter data in 2013–14. We are also working toward acquiring additional 0.5-meter LiDAR data in areas of northern Utah in 2015. Several UGS projects highlight the utility of the recently acquired LiDAR data. These include geologic mapping of the Salt Lake City North quadrangle, fault trace mapping along the Wasatch fault zone, and landslide mapping on the Wasatch Plateau.
Geologic Mapping of the Salt Lake City North Quadrangle
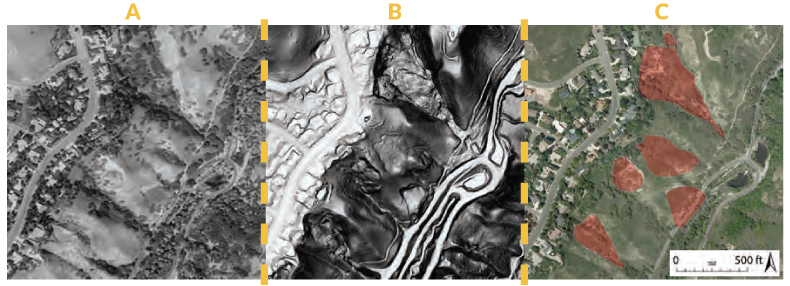
New geologic mapping of the Salt Lake City North quadrangle used two vintages of LiDAR data to map landslides in City Creek Canyon: 2-meter data acquired in 2006 and 0.5-meter data acquired in 2013–14. LiDAR-derived hillshade and slopeshade images were particularly effective tools for enhancing and identifying landslide geomorphology.
Landslide terrain appears on hillshade and slopeshade images as a rough ground surface relative to the comparatively smooth surface of the adjacent undisturbed ground. Previous geologic maps of the City Creek area only showed the main City Creek landslide, a historically active landslide that lies between Capitol Boulevard and the City Creek Canyon floor. The 2-meter LiDAR data helped to identify seven additional landslides in the immediate vicinity, but some of the landslide boundaries remained uncertain even after field checking. Hillshade and slopeshade images created from the new 0.5-meter LiDAR data clarified the landslide boundaries and allowed for more detailed landslide mapping and a high degree of confidence.
In addition to landslide mapping, LiDAR data contributed to more detailed and accurate mapping of traces of the Warm Springs fault of the Wasatch fault zone and Granger and Taylorsville faults of the West Valley fault zone in the Salt Lake City North quadrangle, as well as surficial geologic mapping of the quadrangle as a whole.
Fault Trace Mapping along the Wasatch Fault Zone
LiDAR data are being used to generate new fault trace maps along the Wasatch fault zone, including the Malad City, Clarkston Mountain, and Collinston segments at the north end of the fault zone; the Salt Lake City and Provo segments in the central part of the fault zone; and the Levan and Fayette segments at the south end of the fault zone. The 0.5-meter LiDAR data acquired in 2013–14 are serving as the primary tool for this mapping, in addition to historical aerial photography and on-the-ground field checking. Over the course of this project, many previously unmapped fault traces have been identified thanks to the high resolution of the new LiDAR data.
In the past, low-sun-angle aerial photography had become a standard tool for mapping fault scarps. In this technique, photographs are taken from an aircraft during morning or evening hours depending on whether the fault scarps are dominantly west- or east-facing, respectively; the low angle of the sun results in steep scarp faces appearing as linear shadows. LiDAR-derived slopeshade and hillshade images have the advantage of being able to manipulate the DEM to maximize the digital “shadow” effect, which is extremely helpful for mapping very small scarps and those having a trend that varies from north-south. Using a combination of these viewing methods, as well as LiDAR-derived surface contour maps, fault scarps can be mapped with high accuracy.
The very high resolution of the 0.5-meter LiDAR data has allowed us to more accurately map traces of the Wasatch fault zone, even in areas of dense vegetation, and has helped us identify many additional traces of the fault that cross areas of potential future development.
Landslide Mapping on the Wasatch Plateau
LiDAR data acquired in 2011 included a roughly 64-square-mile area in the Manti–La Sal National Forest in the central part of the Wasatch Plateau, within the area of a multi-year landslide mapping project by the UGS in cooperation with the U.S. Forest Service (USFS). The 1-meter data were acquired in an area of planned landslide inventory mapping where the geology, vegetation types and densities, and topography are highly variable. This landslide inventory mapping served as a test case to compare the LiDAR-based surficial geologic mapping with more traditional mapping methods, including stereo aerial-photograph interpretation, topographic map examination, and field mapping.
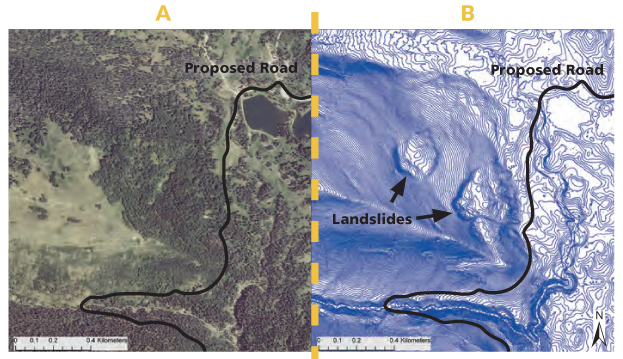
The high-resolution LiDAR data have proven to be very beneficial for mapping landslides on the Wasatch Plateau. Notably, LiDAR enhances surficial mapping abilities on heavily vegetated slopes. Within the LiDAR acquisition area, several landslides were easily identifiable on tree-covered slopes that were otherwise difficult or impossible to observe by traditional methods. A good example of where LiDAR proved beneficial is an area near a proposed USFS road relocation southwest of Potters Ponds. On aerial photographs, a forested slope adjacent to the proposed road alignment shows no clear evidence of landsliding, and potential landslide features are difficult to discern. However, a LiDAR-derived contour map shows landslide geomorphology very clearly, including internal landslide features and areas of younger, inset landsliding.
In general, LiDAR enabled more detailed mapping of landslides in the Wasatch Plateau landslide inventory area, and the 1-meter resolution improved mapping accuracy and efficiency over traditional mapping methods.
Conclusions
Overall, LiDAR is proving to be an extremely useful tool that enhances our surficial geologic mapping capabilities. In a few cases, LiDAR did not improve mapping of problematic areas where visibility on aerial photographs was relatively good. Like any mapping tool, LiDAR should not be relied on alone, and detailed fieldwork remains indispensable for a full understanding of the geology specific to an area. But, while a compass, stereoscope, aerial photography, rock hammer, and hand lens are still essential tools, LiDAR is a great addition to any geologist’s toolbox.
Survey Notes, v. 47 no. 1, January 2015


