Virtual Geologic Map Overlays: A New Way to Visualize Geologic Map Information
By Robert F. Biek, Kent D. Brown, and Lance Weaver
There is no better way to understand how the landscape has evolved and how it relates to underlying rocks and sediments than through the use of a regional-scale geologic map. Yet no matter how much geologists relish them, and how much planners, engineers, and natural resource professionals use them in their daily work, geologic maps are a specialty tool that requires training to be properly used and interpreted. It’s a crime—for all the important information that they convey, geologic maps remain obscure to most of the general population who could benefit from their use.
The principal difficulty that most people have when looking at a geologic map is not being able to visualize the third dimension—the surface topography that is portrayed by contour lines on most geologic maps. Without an understanding of topography, of what the landscape actually looks like, a geologic map appears to most people as just a pretty (or weird looking!) color image. A good base map, however, allows savvy map users to accurately locate landscape and major cultural features and, importantly, see their relationship to underlying rocks and sediments.
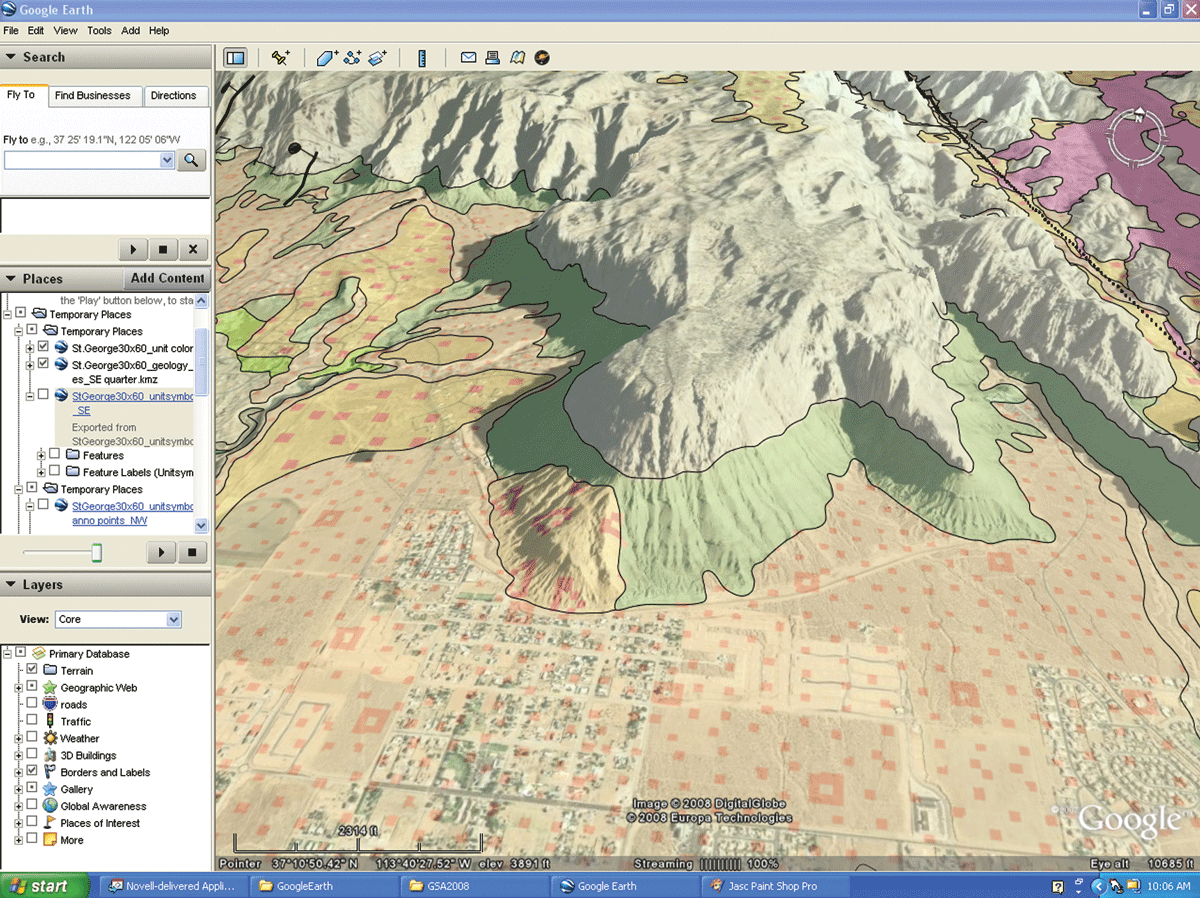
Through the use of computers and the Internet, and virtual globes such as Google Earth, we now have a way around the inherent limitations of depicting the third dimension on a standard paper geologic map. In fact, one of the most powerful applications of Google Earth or other virtual globes is the ability to overlay transparent geologic maps on a three-dimensional surface, and, using built-in navigational tools, view the landscape and geology at any angle and at any scale. This “bird’s-eye view” enables users to better appreciate what geologic maps show.
To help users gain this 3-D advantage, we created an overlay of the new geologic map of the St. George 30′ x 60′ quadrangle in southwest Utah (the map is currently in final stages of review), in addition to the standard published map. This 3-D visualization brings the map to life, dramatically showing the relationship between geology and topography. It also enables map users to better appreciate the fourth dimension shown by geologic maps—geologic time, as represented by the stacking order of bedrock formations, because younger rock layers typically overlie older rock layers—and to better appreciate the shape and extent of surficial deposits, which are where most development takes place and most geologic hazards are found.
We also created a virtual field trip for the St. George30′ x 60′ quadrangle, which uses placemarks to highlight selected geologic features. Users can navigate the map and placemarks on their own, or take a virtual tour that will automatically travel from one selected feature to another. The virtual geologic map and field trip are available on the UGS website at 3-D Geologic Map Overlays & Virtual Geologic Field Guides.
Survey Notes, v. 41 no. 2, May 2009


